See reported activity across the map
Step back from individual pins to see how published reports are distributed across an area. The activity-area heatmap is in development.
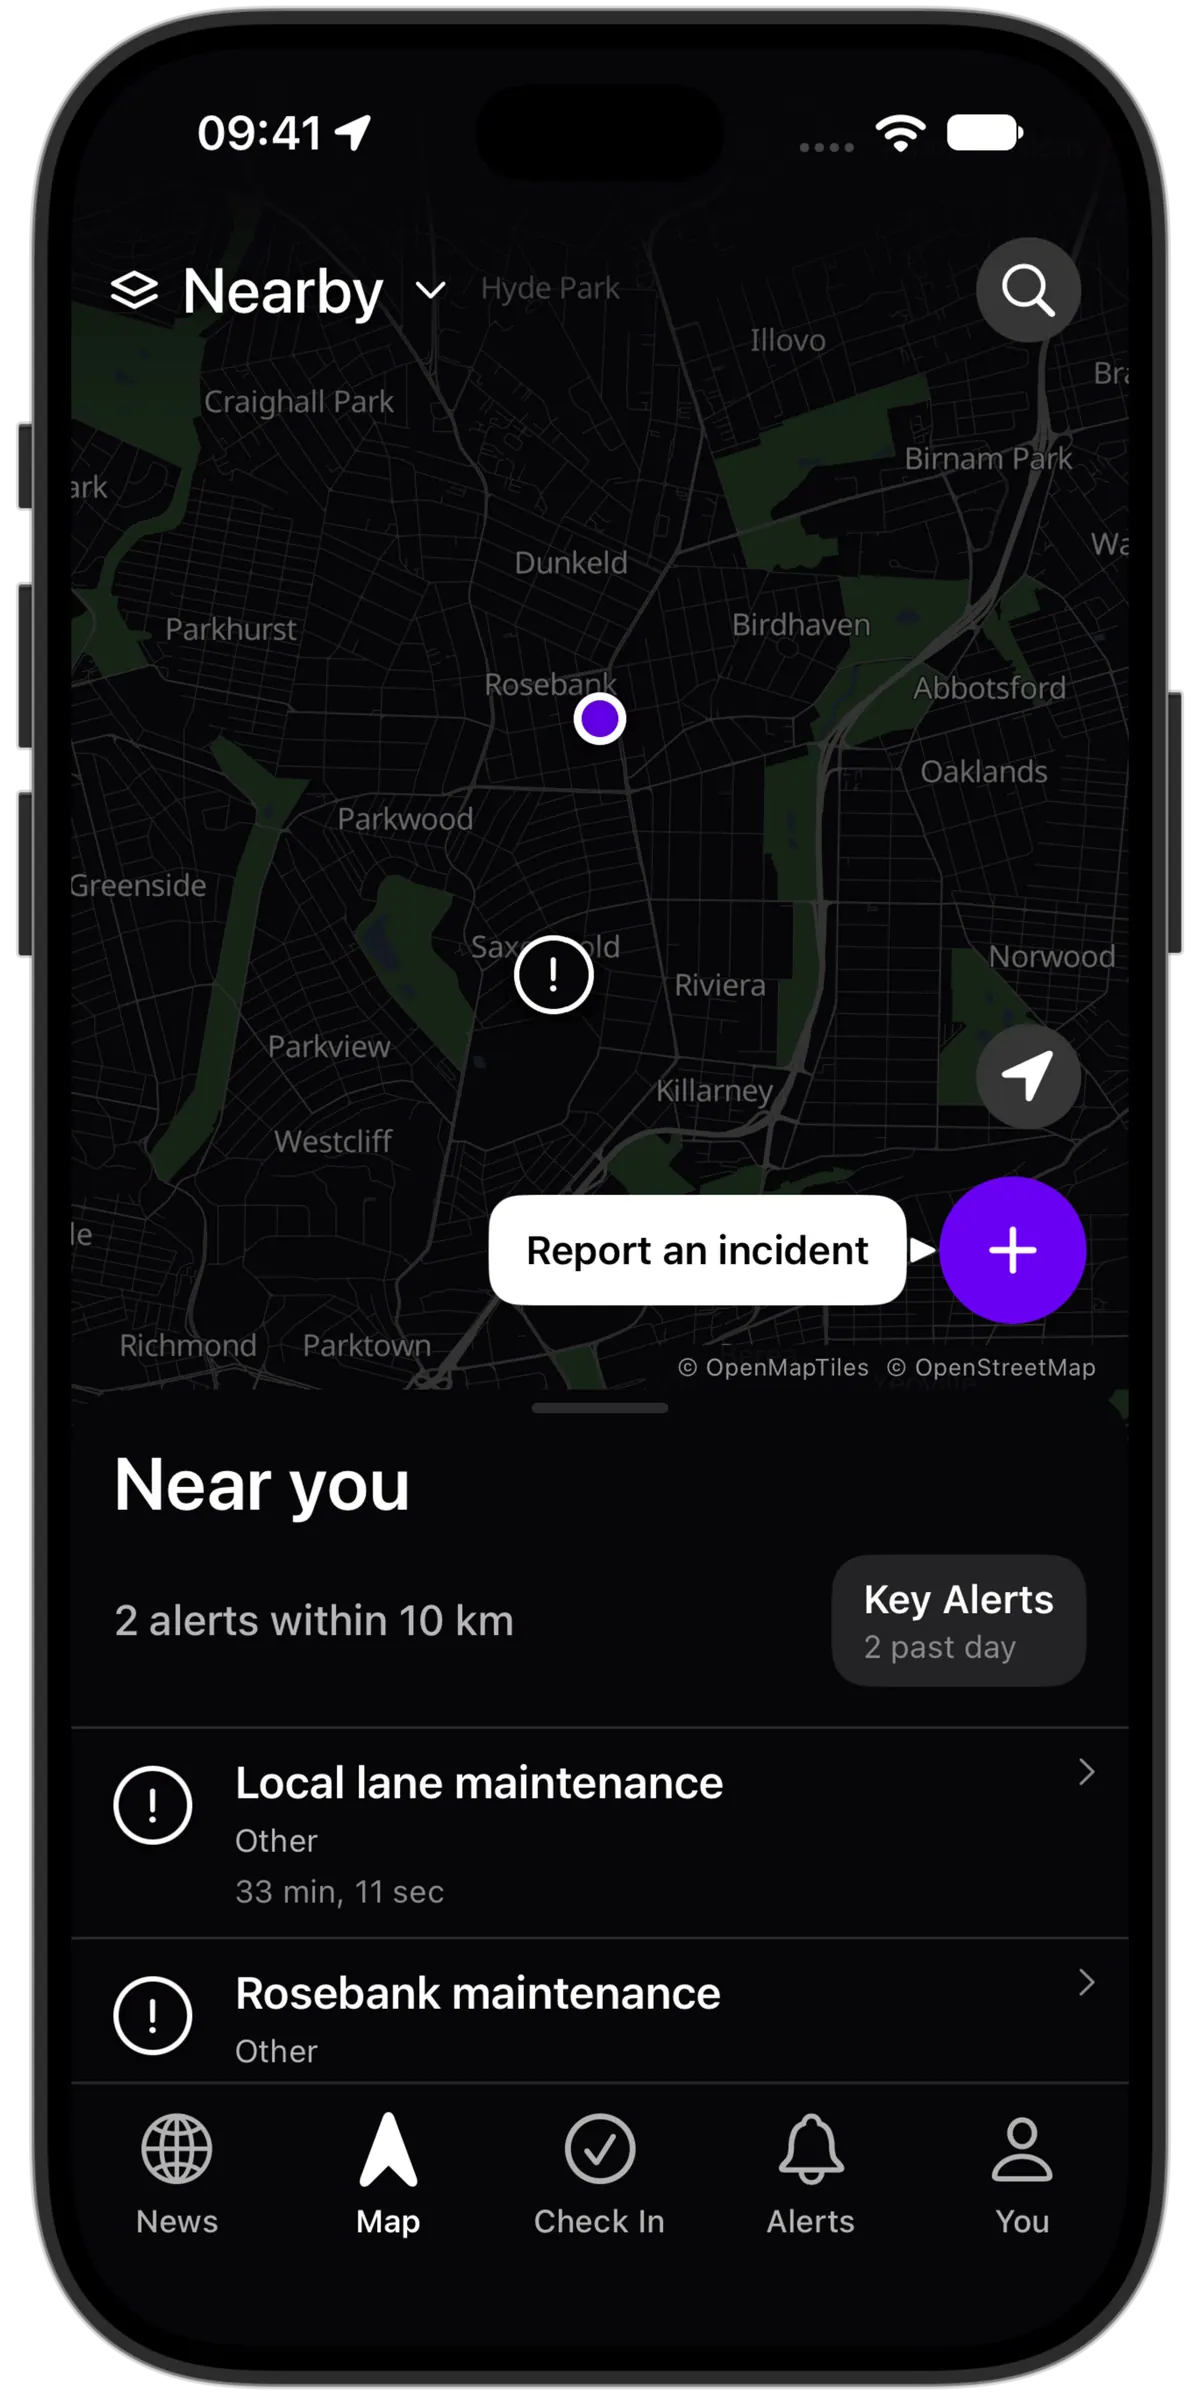
A different view of the same public information
Switch to Activity areas to explore grouped incident activity within the area you’re viewing. The heatmap describes reports published in Lookout, not everything that happened in a neighbourhood.
Broad patterns, with privacy limits
- Map cells, not people
- Activity is grouped into areas. This view does not reveal a reporter’s private submission or a family member’s shared location.
- Count bands
- Broad count ranges provide context without exposing the underlying individual locations.
- Small counts withheld
- Some areas may not show activity until the privacy threshold is met. A blank area is not evidence that nothing happened there.
- Follow the viewed area
- Move the map to explore another place. The activity layer uses the area you’re viewing rather than loading an unrestricted global history.
Context rather than a safety rating
These are not official crime statistics or labels of safe and dangerous places. For changes over 7, 30 or 90 days, use area summaries. Heatmap launch depends on reviewed public information and sufficient coverage.